I edit .md files on the GitHub website and GitHub converts those files into HTML pages. My computer froze up when I was preparing this post. I restarted the computer. Everything went away as I didn’t commit changes before the freeze. No autosaving with GitHub online editor :(
Let’s get down to business. I forked a project from qtplot. It is quite useful for visualizing/filtering/line-cutting 2d (or 1d) data. The program produces figures with Matplotlib (a Python library). There is a problem.
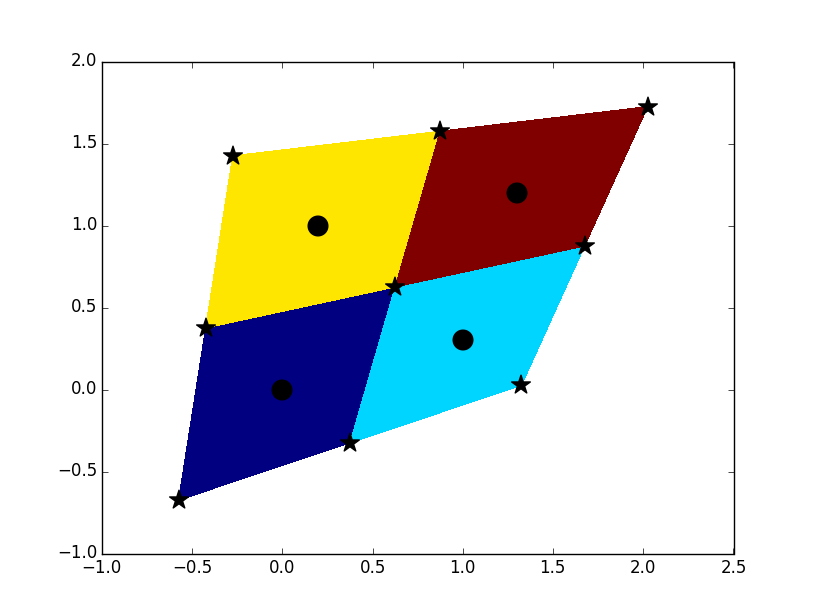
Several functions are provided by Matplotlib to generate 2D heatmaps, such as pcolormesh(), pcolor(), imshow(), matshow(), figimage()… The first two are similar, so does the second two. I don’t know the last. If the data, which consists of 3 2D-arrays X, Y, Z, are uniformly sampled from the x-y plane, we can use imshow() which plot each datapoint as a “pixel” in the figure. Otherwise, one needs pcolormesh(), which draws polygon patches for datapoints as follows:

This is a snapshot captured here
An example of pcolormesh:
import matplotlib.pyplot as plt
import numpy as np
def get_quad(x):
    '''
    calculate the patch corners
    '''
    l0, l1 = x[:,[0]], x[:,[1]]
    r1, r0 = x[:,[-2]], x[:,[-1]]
    x = np.hstack((2*l0 - l1, x, 2*r0 - r1))
    t0, t1 = x[0], x[1]
    b1, b0 = x[-2], x[-1]
    x = np.vstack([2*t0 - t1, x, 2*b0 - b1])
    x = (x[:-1,:-1]+x[:-1,1:]+x[1:,:-1]+x[1:,1:])/4.
    return x

x = np.array([[0.,1.],
            [0.2,1.3]])
y = np.array([[0.,0.3],
            [1,1.2]])
z = np.array([[0,1],
            [2,3]])
x1,y1 = get_quad(x),get_quad(y)

#plot the data
plt.pcolormesh(x1,y1,z)
#plot location of datapoint
plt.scatter(x.ravel(),y.ravel(),s=200,color='k')
#plot the patch corners
plt.scatter(x1.ravel(),y1.ravel(),s=200,marker='*',color='k')
plt.show()
So far so good. But what if we save the pcolormesh() figure to some vector graphic formats, such as SVG or PDF, and open them in other programs:
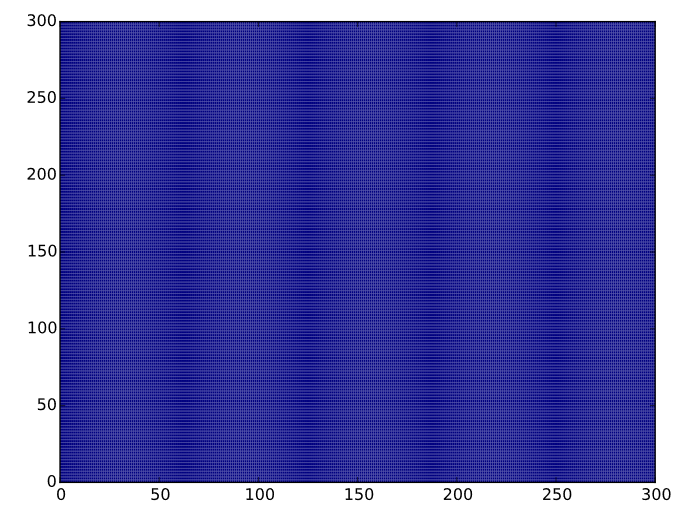
plt.pcolormesh(np.zeros((10,10)))#or 300,300
SVG file in Chrome, 10*10 array. There are white lines between patches, even though the space between patches should be 0:

SVG file in IE, 300*300 array:
PDF file in chrome, 300*300 array, looks good. While these PDF files look good in Chrome or Adobe Reader, they are not good in Adobe Illustrator or Inkscape. The result depends on the kernel of the viewer:

.pdf file in chrome, using the previewer on overleaf.com, 300*300 array, white lines are back:

This problem has been discussed in many places. Here’s a link. The reason for white lines is that some (or many) programs aren’t smart enough to show two polygons sharing the same edge. In addition to the white lines, another disadvantage of pcolormesh (pcolor) generated vector graphs is that when there are too many patches, it will be very slow to open them from other programs. One solution is to rasterize the figure so that it is based on pixels, but you may lose some information if the dpi is not high enough. imshow() also resamples your data by default as discussed here. A trick is to set interpolation=’none’. It works for PDF but doesn’t work for SVG (ref.). I prefer to save figures as SVG files for Inkscape (PDF is also fine…). Just as the old saying goes, you press the gourd from one side, then the other side bobs up. :(